
MONTHLY UTILITY BILLING AUDITS IDENTIFY ANOMALIES
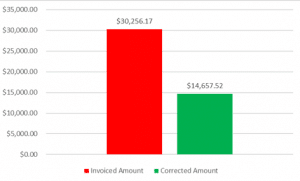
Recently, while completing the Monthly Utility Bill Analysis Module, an Asset in Indiana was found to have been invoiced over 106% more than the average bill.
Utility waste in the US is at an all-time high with ~60-80% of the energy consumption being attributed to waste and errors (source below)
This anomaly was noted and investigated by AFI staff and the following errors were discovered:
- Human data-entry error: The technicians at the utility company entered the meter data incorrectly (scrivener error).
- Meter Change: A new meter was installed at the property by the utility company further complicating data collection and reporting.
The total savings for this error? $14,657.52![]()
Had the utility bill not been audited, it is unlikely the invoice would have been corrected by the utility company due to the complex nature of the error.
HOW CAN ERRORS IN UTILITY BILLING BE AVOIDED?
- All utility bills should be managed at a single location to allowing for data aggregation and institutional knowledge to develop.
- All utility bills should be handled by a single team to ensure that consistent monthly KPIs are utilized. For example, AFI has a single team analyzes trailing cashflow and consumption data each month on a per unit basis.
- Utility data is analyzed on a global basis to allow for highlighting anomalies. Anomalies can be not only data-entry errors, but also might include leaks, incorrectly set HVAC systems, power drains, etc. By completing a global analysis, a granular comparison is able to be created cross-systems to highlight outliers. Additionally, by aggregating data, a larger comparison group is created. AFI, for example, analyzes ~250 meters and 5000 units. The more data available, the better.
Consider implementing a utility analysis system today of your own to prevent errors and waste. Not only are invoice errors expensive, they are potentially wasteful to energy resources and money.
https://www.erc-co.org/spooky-statistics-about-energy-and-water-waste/
FACT: One drop per second from a leaky faucet could equate 2,700 gallons a year.